Blender is one of the most widely adopted open-source 3D creation suites, equipped with industry-grade tools for modeling, animation, and rendering. Its Cycles and Eevee engines deliver highly realistic visuals while taking advantage of modern GPU acceleration for significant performance gains.
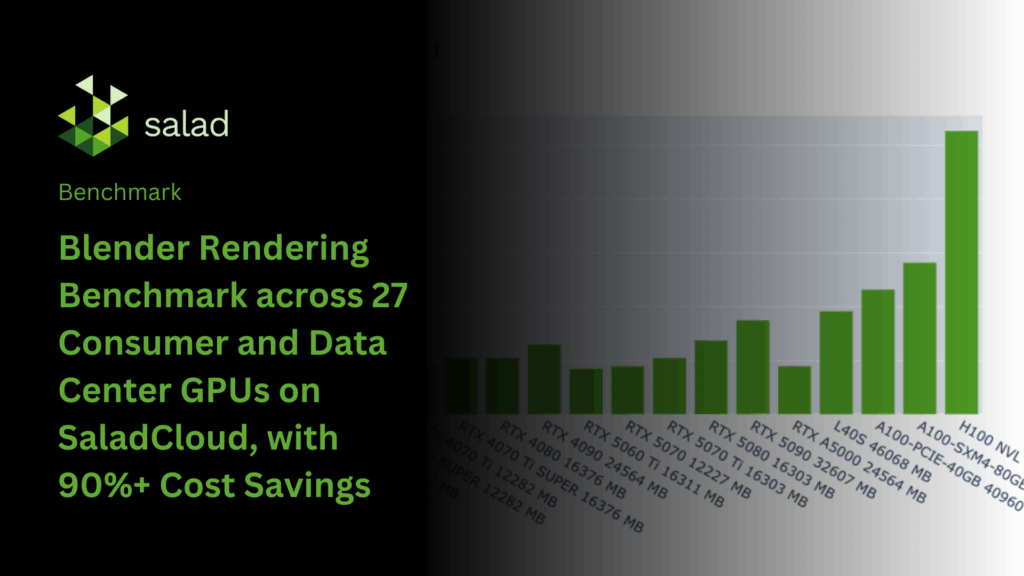
In this analysis, we benchmark Blender rendering on SaladCloud, comparing rendering speed and cost-efficiency across multiple GPU types. The results highlight performance trade-offs between consumer-grade and data center hardware, showing how creative professionals and studios can build scalable, high-performance rendering pipelines on SaladCloud. This approach enables virtually unlimited rendering throughput while reducing costs by over 90% compared to traditional data center GPU solutions.

Benchmark Methodology
The Blender Benchmark Launcher – Linux CLI is part of the official Blender Open Data Benchmark project. It’s a command-line tool that runs standardized Cycles rendering benchmarks without opening the Blender UI or manually configuring scenes.
In Blender’s Cycles engine, a sample represents one light-ray calculation per pixel. At a resolution of 1920×1080, a single frame contains over two million pixels, so increasing the number of samples per pixel produces cleaner, less noisy renders. The benchmark measures how many samples can be completed for all pixels in a frame within a fixed time, providing a consistent metric of machine performance.
The benchmark uses three common scenes—Classroom (1920×1080, 300 samples per pixel), Monster (1024×1024, 256 samples per pixel), and Junkshop (2000×1000, 240 samples per pixel)—rendering a single frame from each for a fixed duration (30 seconds) or until the scene’s target samples are reached. Rendering is performed using the Cycles engine on either the CPU or GPU. The total number of samples completed per minute across all scenes is calculated and summed to produce the final score for each test machine.
When using NVIDIA GPUs, the Cycles engine supports two rendering backends: CUDA and OptiX. OptiX, built on top of CUDA, leverages hardware RT Cores for accelerated ray tracing. Since not all NVIDIA GPUs have RT Cores, the benchmark only uses the CUDA backend for compatibility, which may result in lower performance.
The following command runs the benchmark in the target environment:
./benchmark-launcher-cli benchmark --blender-version 4.5.0 --device-type CUDA --json monster junkshop classroomThe Blender Open Data Benchmark score is a relative performance metric based on the total number of samples rendered per minute across the benchmark scenes. It allows comparison across different CPUs and GPUs, but does not directly reflect absolute rendering times or costs for real-world scenes, which depend on factors such as scene complexity, resolution, sample count and specific hardware.
To address this, we perform additional benchmarks to measure the actual time required to reach the target samples for a single frame in each scene. From this, we calculate metrics such as average hourly rendered frames and frames per dollar across the combined scenes on a SaladCloud node. The benchmark can be executed using the following command:
blender -b .../classroom/main.blend -o output/classroom/frame_##### -F PNG -f 1 -- --cycles-device CUDA

blender -b .../monster/main.blend -o output/monster/frame_##### -F PNG -f 1 -- --cycles-device CUDA

blender -b .../junkshop/main.blend -o output/junkshop/frame_##### -F PNG -f 1 -- --cycles-device CUDA
The rendering process includes scene loading, warm-up, and rendering, with multiple frames in an animation sharing the preparation time, improving rendering performance and cost efficiency per frame. The Blender Open Data Benchmark score already excludes this preparation time. For our additional benchmarks, however, we treat each frame as an independent job, measuring the full end-to-end time. This represents a conservative, worst-case scenario.
Please refer to the link for the Dockerfile and benchmark code. When run on SaladCloud, the workflow first executes the benchmarking code, reports the results to an AWS DynamoDB table, and then exits. The data is subsequently downloaded and analyzed using Pandas in JupyterLab.
The three benchmark scenes—Classroom, Monster, and Junkshop—each require between 1 and 5 GB of VRAM to render. We benchmark both consumer GPUs (16 vCPUs, 16 GB RAM, all GPU models with ≥ 8 GB VRAM) and data center GPUs (32 vCPUs, 256 GB RAM, all GPU models). On multi-GPU nodes, we set CUDA_VISIBLE_DEVICES to ‘0’ so that only the GPU 0 is accessible to Blender during benchmarking.
In total, we gathered data from more than 3,000 Salad nodes spanning 27 GPU models, ensuring broad and representative coverage for each.
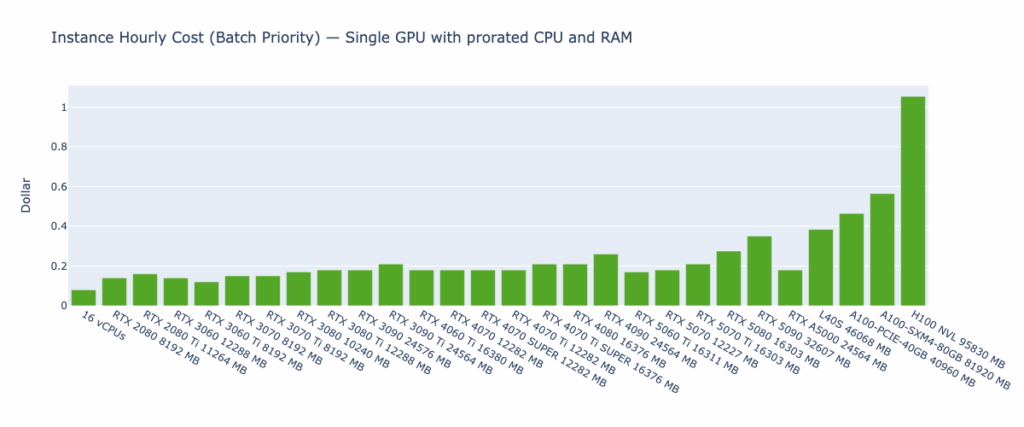
Batch priority was used to run the benchmarking workloads on SaladCloud, meaning that they could be preempted by high-priority workloads but significantly reduce costs for batch rendering. For pricing calculations on multi-GPU nodes, the cost of CPU and RAM is prorated based on the usage of a single GPU. The hourly cost for each GPU instance type included in the benchmark is shown below:
It is worth mentioning that performance can be influenced by many factors, such as operating systems (Windows, Linux, or WSL) and their versions, CPU models, GPU models, and driver versions, CUDA framework versions, Blender versions and additional features enabled in the runtime environment. It is very common to see different results between our benchmarks and those of others.
Benchmark Results

Key Observations
The Blender Open Data Score highlights the significant performance gap between a 16-vCPU setup and various GPUs
Blender Cycles with the CUDA backend primarily relies on CUDA cores and performs most computations in single precision (FP32). Rendering performance scales with both the number of CUDA cores and the available memory bandwidth, which is why high-end GPUs consistently outperform lower-end models. However, the flagship cards of an older generation often remain faster than the entry-level models of the next generation, since raw FP32 throughput and bandwidth typically outweigh incremental architectural improvements.
Blender Cycles using the CPU backend with 16 vCPUs is much slower than any GPU with the CUDA backend, achieving only a few percent of GPU performance. This is because CPUs have far fewer cores and lower memory bandwidth. Since rendering in Cycles is highly parallel, GPUs—with thousands of FP32 cores optimized for throughput—can complete tasks several to tens of times faster than CPUs.
Consumer GPUs, such as the RTX 4090 and 5090, often outperform data center GPUs like the A100 and H100 for Blender Cycles rendering. They are optimized for high FP32 throughput, faster clock speeds, and graphics-focused memory architectures, whereas data center GPUs are designed primarily for FP64 calculations and AI workloads. As a result, these GPUs deliver superior speed and efficiency for path-traced rendering.
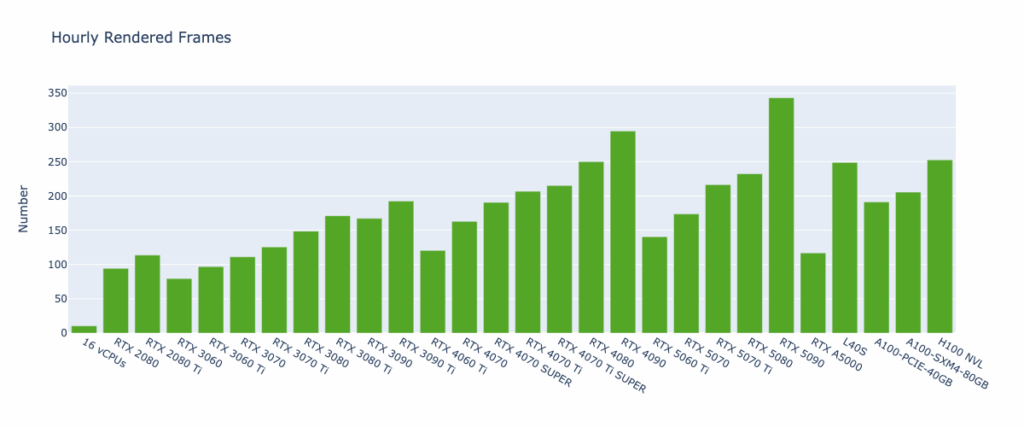
The Hourly Rendered Frames metric provides insights similar to the Blender Open Data Score but is more directly actionable. By rendering a single frame for scenes like Classroom, Monster, and Junkshop, it estimates the achievable rendering throughput on different GPU types—ranging from around 10 frames per hour (16 vCPUs) to over 300 (RTX 5090). Among all tested hardware, the RTX 4090 and RTX 5090 stand out as the top-performing GPUs. However, for larger or more complex scenes requiring more than 32 GB of VRAM, data center GPUs remain important options despite their comparatively lower performance.
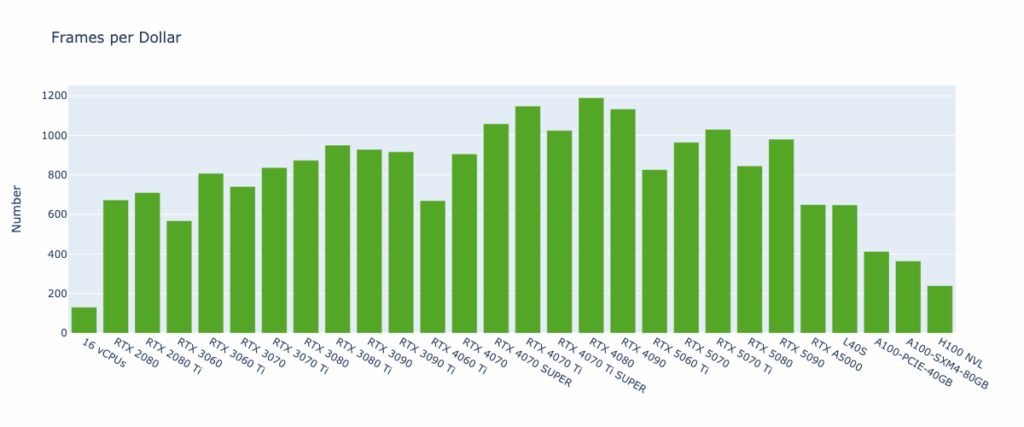
The Frames per Dollar metric complements Hourly Rendered Frames by factoring in cost efficiency. It measures how many frames can be rendered per dollar spent, enabling direct comparisons of GPU types not only on performance but also on economic value.
The results show that the number of frames rendered per dollar can vary dramatically depending on the GPU—ranging from fewer than 150 frames (16 vCPUs) to nearly 1,200 frames (RTX 4080). Furthermore, the relatively low VRAM requirements of scenes do not mean that low-end GPUs with lower hourly costs are always the most economical choice. In practice, high-end GPUs often deliver more rendering output per dollar.
The RTX 40-series consistently proves to be the most cost-effective option among consumer GPUs, and offers on average 3× the cost efficiency of data center GPUs. Meanwhile, SaladCloud provides data center GPUs at hourly rates often one-third—or even less—than hyperscaler pricing. Combined, these advantages make it possible to cut rendering costs by 90% or more when migrating workloads to SaladCloud.
As noted earlier, the rendering process includes scene loading, warm-up, and rendering. The Hourly Rendered Frames and Frames per Dollar metrics are calculated under the assumption that all render jobs are independent, with each job rendering a single frame per scene. In real animation workloads, where multiple frames share the same scene and preparation steps, actual performance and cost efficiency per frame can be even higher.
SaladCloud: The Right Choice for Blender Rendering
Based on benchmark tests, consumer GPUs are the preferred choice for Blender rendering, offering superior performance over data center GPUs while significantly reducing costs. With proper design and implementation, it is possible to build a high-throughput, reliable, and cost-effective rendering system on SaladCloud, capable of handling large-scale workloads and achieving up to 90% cost savings compared to hyperscaler solutions.
For workloads requiring millions of jobs in a short time, or access to hundreds of GPUs—including different types for testing or research—SaladCloud provides an ideal platform.
Interested in running your workload on SaladCloud Secure (H100s, A100s, L40S, and more)? Check out SaladCloud Secure.
SaladCloud is the world’s largest distributed cloud computing network with 11,000+ daily GPUs and 450,000 GPUs contributing compute, all at the lowest cost in the market.