Since our last SDXL benchmark nearly a year ago, a lot has changed. Community adoption of SDXL has increased significantly, and along with that comes better tooling, performance increases, and better understanding of how to get good results from the model. While we previously used SD.Next for inference, ComfyUI has become the de facto image generation inference server for most professional use, owing to its high degree of flexibility, best in class performance, and it is nearly always first to support new models and technologies. SaladCloud has introduced new priority pricing levels, offering significantly lower prices on all GPUs, including top of the line models like RTX 4090. These factors combine to yield much lower per-image inference costs than we achieved previously, and with a much simpler build.
Benchmark Design
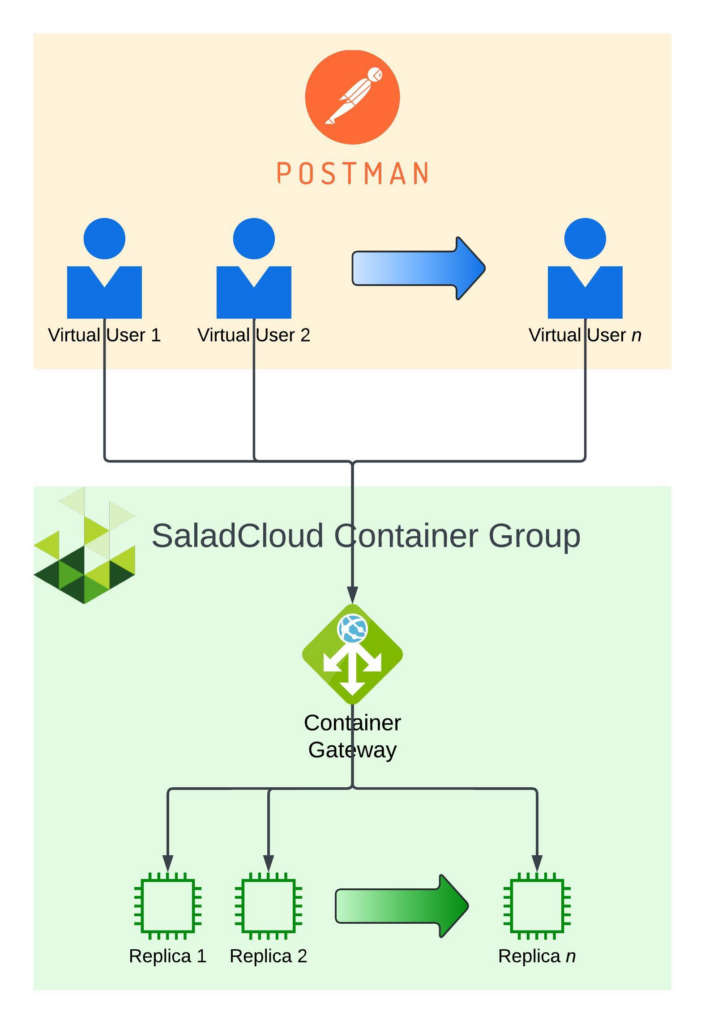
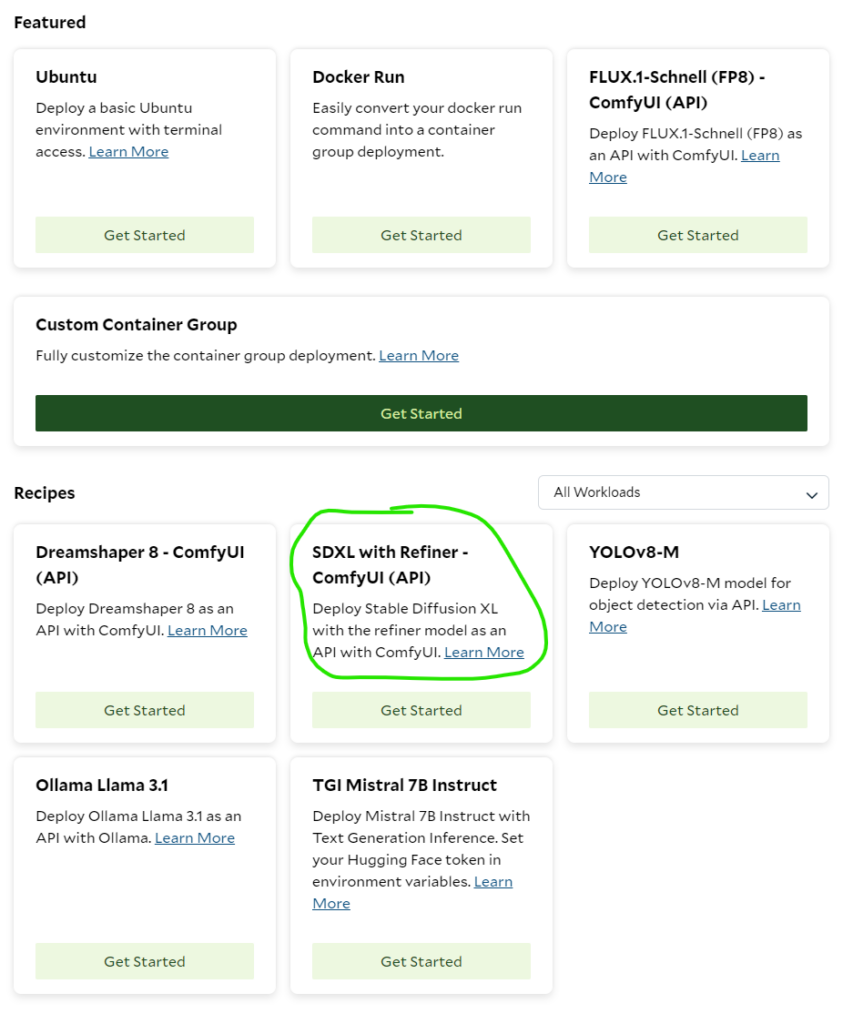
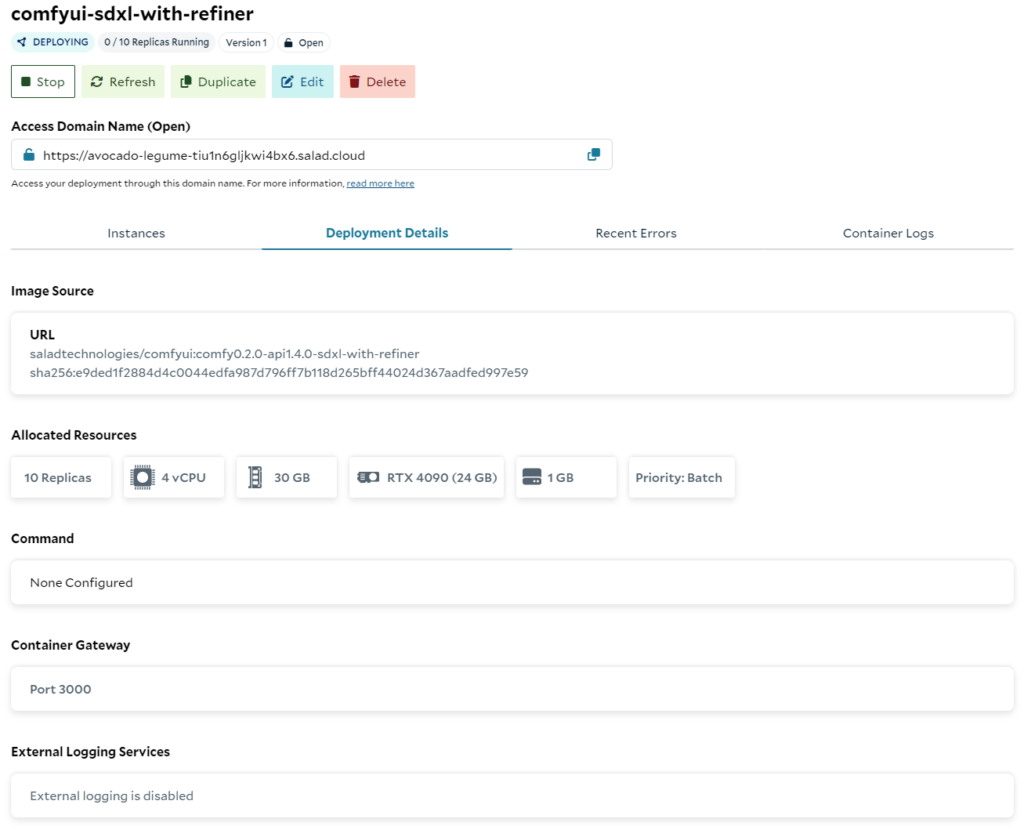
We deployed the “SDXL with Refiner – ComfyUI” recipe on Salad, using the default configuration, but setting priority to “batch”, and requesting 10 replicas. We started the benchmark when we had at least 8/10 replicas running.
We used Postman’s collection runner feature to simulate load , first from 10 concurrent users, then ramping up to 18 concurrent users. Each test ran for 1 hour. Our virtual users submit requests to generate 1 image like this:

- Prompt: vivid watercolor painting of a tropical beach, stunning, beautiful
- Negative Prompt: text, watermark, hands
- Resolution: 1024×1024
- Base Model Steps: 20
- Refiner Model Steps: 5
- Sampler: Euler
- Scheduler: Normal
We duplicated this setup to test RTX 3090 (24gb vram), RTX 4080 (16gb vram), and RTX 4090 (24gb vram).
What we measured:
- Cluster Cost: Calculated using the maximum number of replicas that were running during the benchmark. Only instances in the ”running” state are billed, so actual costs may be lower.
- Reliability: % of total requests that succeeded.
- Response Time: Total round-trip time for one request to generate an image and receive a response, as measured on my laptop.
- Throughput: The number of requests succeeding per second for the entire cluster.
- Cost Per Image: A function of throughput and cluster cost.
- Images Per $: Cost per image expressed in a different way
Deployment on SaladCloud
Click through the SDXL with Refiner recipe, available from the Container Groups interface, and set replica count to 10. Optionally, set a non-default priority, and/or enable authentication. For our benchmark, we used “Batch” priority, and did not enable authentication.
Results
The RTX 4090 achieved the best performance, both in terms of inference time and cost-per-image, returning images in as little as 6.2s / Image, and at a cost as low as 3405 images / $.
Across all tests we can see that as load increases, average round-trip time increases for requests. We did not always have the maximum requested replicas running, which is expected. SaladCloud only bills for the running instances, so this really just means we’d want to set our desired replica count to a marginally higher number than what we actually think we need.
We saw a small number of failed requests that coincided with node reallocations. This is expected, and you should handle this case in your application via retries.
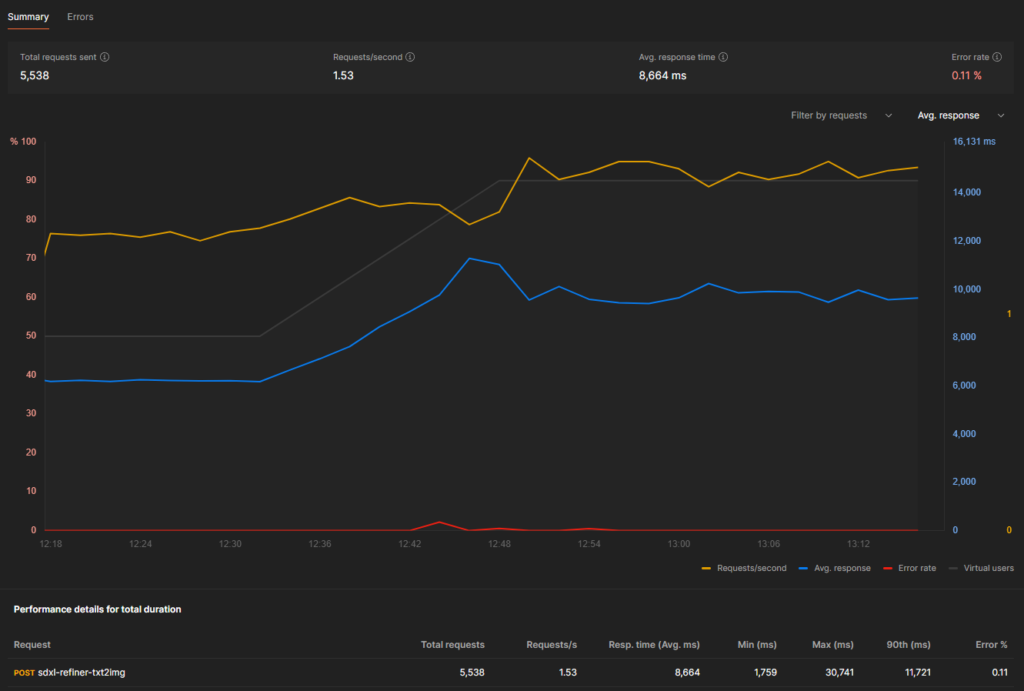
RTX 4090 (24gb vram)
- Maximum running replicas during test: 8, dropping briefly to 7.
- Total Cost of 8 running replicas at “batch” priority: $1.808 / hour
- $0.00050222222 / second
- Reliability: 99.89% of requests succeeded
- Performance at 10 Virtual Users:
- Average Response Time: 6.2 seconds
- Average Throughput: 1.35 requests / second
- Cost Per Image: $0.00037201646
- Images Per $: 2688
- Performance at 18 Virtual Users:
- Average Response Time: 9.6 seconds
- Average Throughput: 1.71 requests / second
- Cost Per Image: $0.0002936972
- Images Per $: 3405
- Performance over total duration:
- Average Response Time: 8.664 seconds
- Average Throughput: 1.53 requests / second
- Cost Per Image: $0.00032824981
- Images Per $: 3046
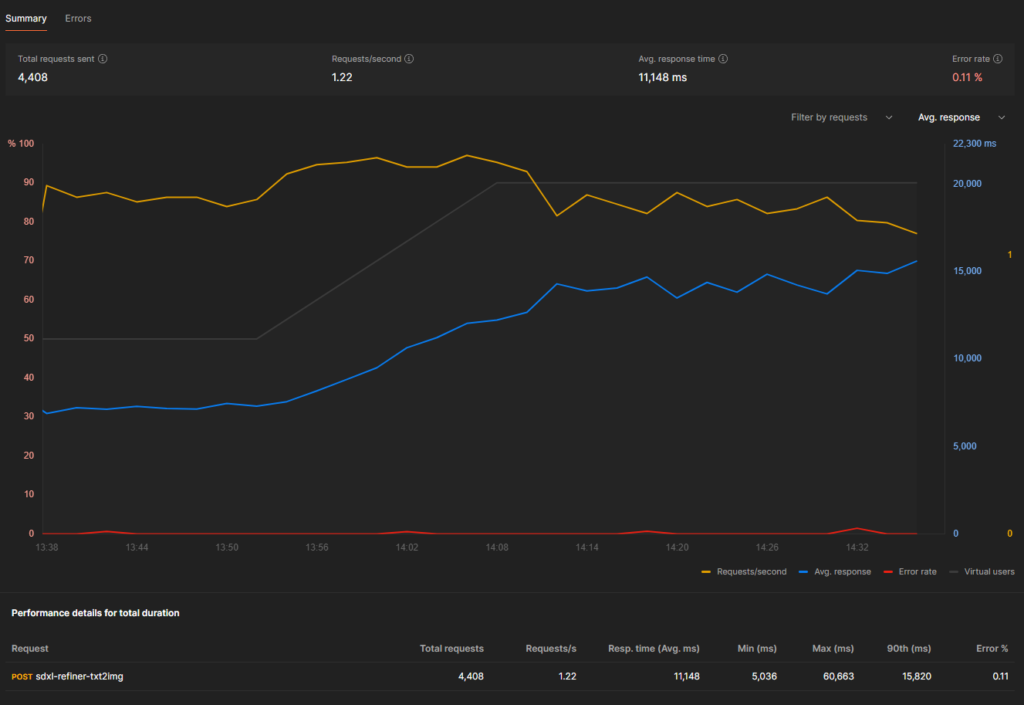
RTX 4080 (16gb vram)
- Maximum running replicas during test: 9, dropping to 7 by the end of the benchmark.
- Total Cost of 9 running replicas at “batch” priority: $1.584 / hour
- $0.00044 / second
- Reliability: 99.89% of requests succeeded
- Performance at 10 Virtual Users:
- Average Response Time: 7.2 seconds
- Average Throughput: 1.20 requests / second
- Cost Per Image: $0.00036666666
- Images Per $: 2727
- Performance at 18 Virtual Users:
- Average Response Time: 14.2 seconds
- Average Throughput: 1.22 requests / second
- Cost Per Image: $0.00036065573
- Images Per $: 2772
- Performance over total duration:
- Average Response Time: 11.148s
- Average Throughput: 1.22 requests / second
- Cost Per Image: $0.00036065573
- Images Per $: 2772
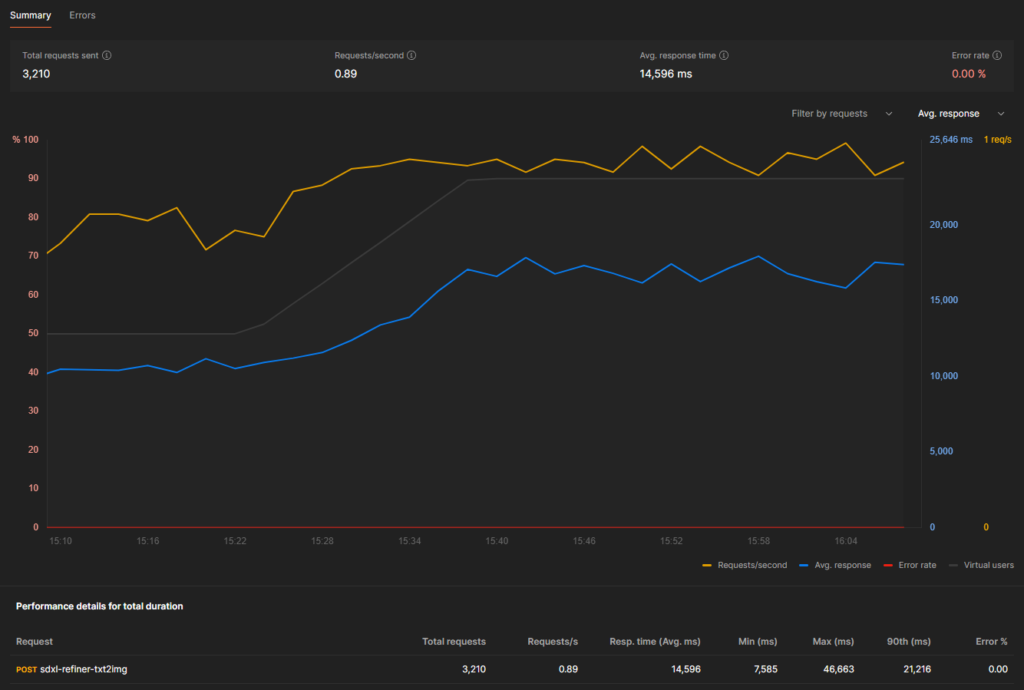
RTX 3090 (24gb vram)
- Maximum running replicas during test: 10, consistent throughout benchmark
- Total Cost of 10 running replicas at “batch” priority: $1.46 / hour
- $0.00040555555 / second
- Reliability: 100% of requests succeeded
- Performance at 10 Virtual Users:
- Average Response Time: 10.56 seconds
- Average Throughput: 0.77 requests / second
- Cost Per Image: $0.00052669552
- Images Per $: 1899
- Performance at 18 Virtual Users:
- Average Response Time: 17.3 seconds
- Average Throughput: 0.95 requests / second
- Cost Per Image: $0.00042690058
- Images Per $: 2342
- Performance over total duration:
- Average Response Time: 14.596s
- Average Throughput: 0.89 requests / second
- Cost Per Image: $0.00045568039
- Images Per $: 2195

Shawn Rushefsky is a passionate technologist and systems thinker with deep experience across a number of stacks. As Generative AI Solutions Architect at Salad, Shawn designs resilient and scalable generative ai systems to run on our distributed GPU cloud. He is also the founder of Dreamup.ai, an AI image generation tool that donates 30% of its proceeds to artists.